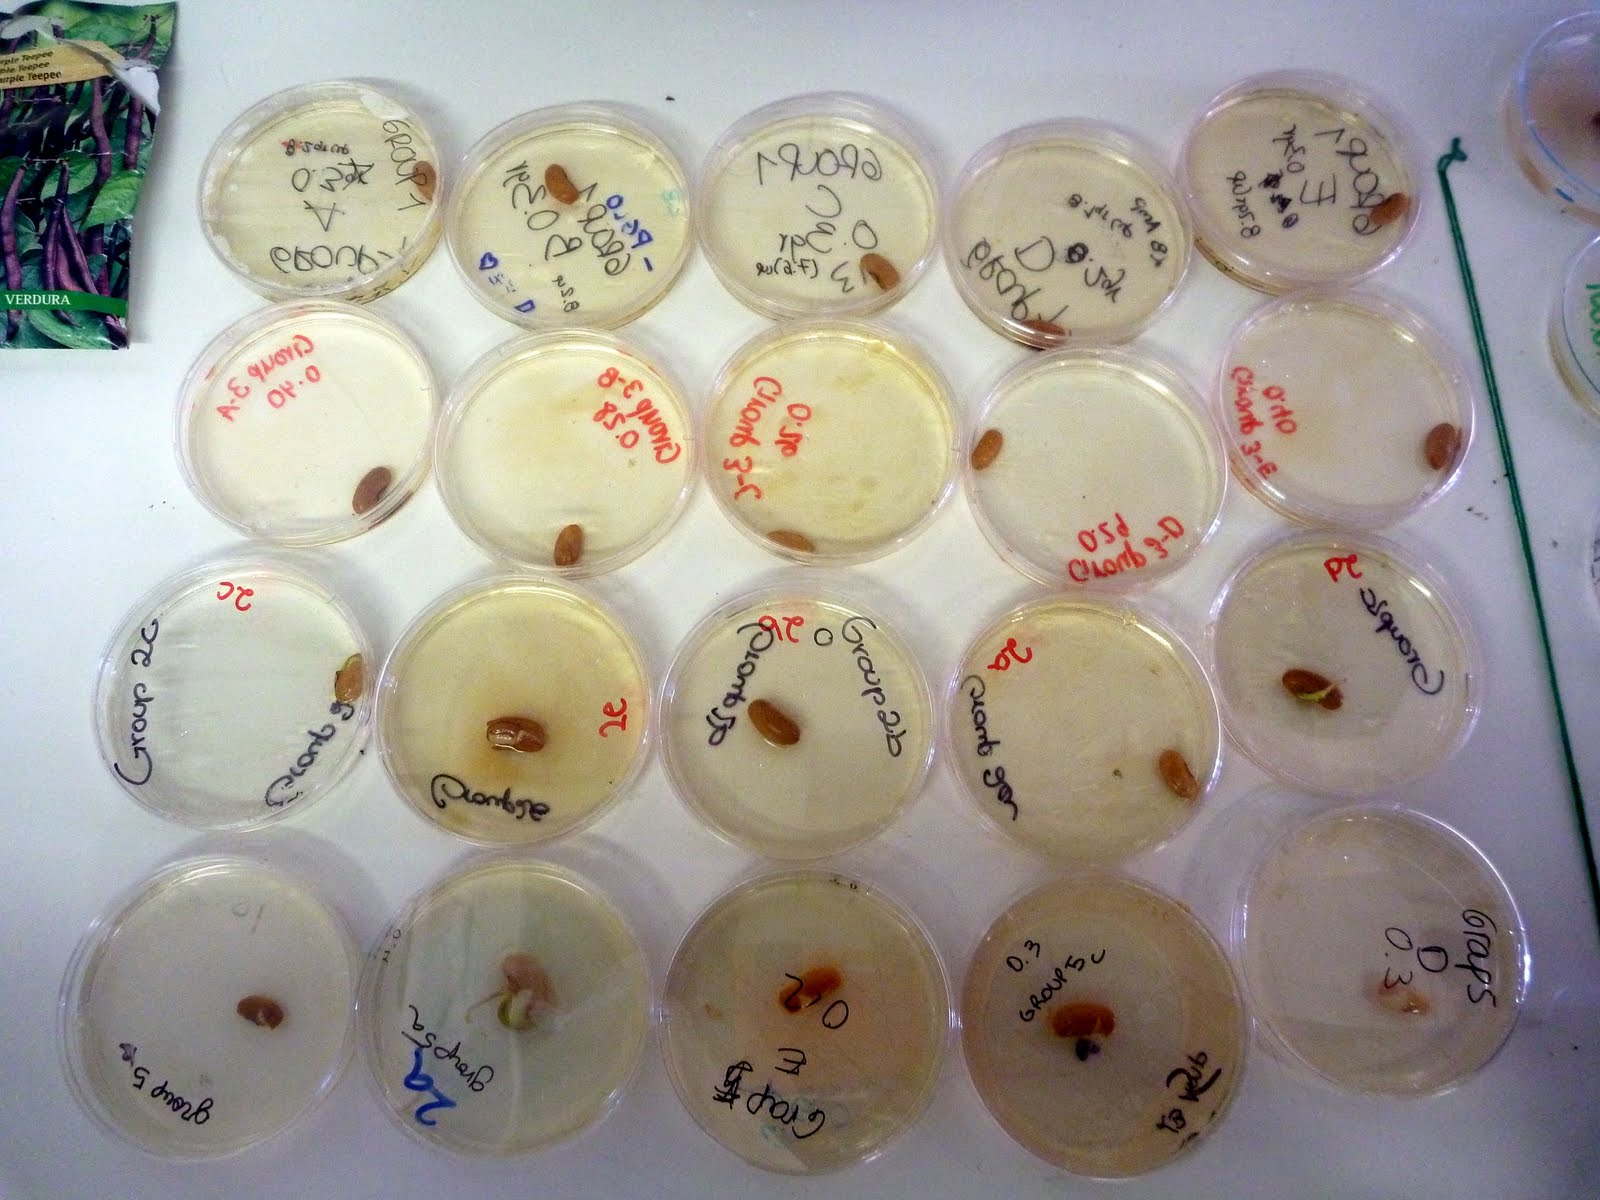
 Picture 1: C period's experiment, a 4 x 5 set up.
 Picture 2: A close up of two of the beans. On the left is an original purple bean, on the right is bean 5a.
Homework:
Part 1: Complete the graphing packet (unless you already finished it in class).
Part 2: Complete the Book Tour. That's right, introduce yourself to your textbook. You will leave this book at home for the majority of the year.
No comments:
Post a Comment